The jam study, and what it really says about too much choice
The famous 24-jam experiment, the replications that didn't match it, and what the research says about choosing well from a long list.
Murari Yarlagadda, founder, Yarlis. 8 min read
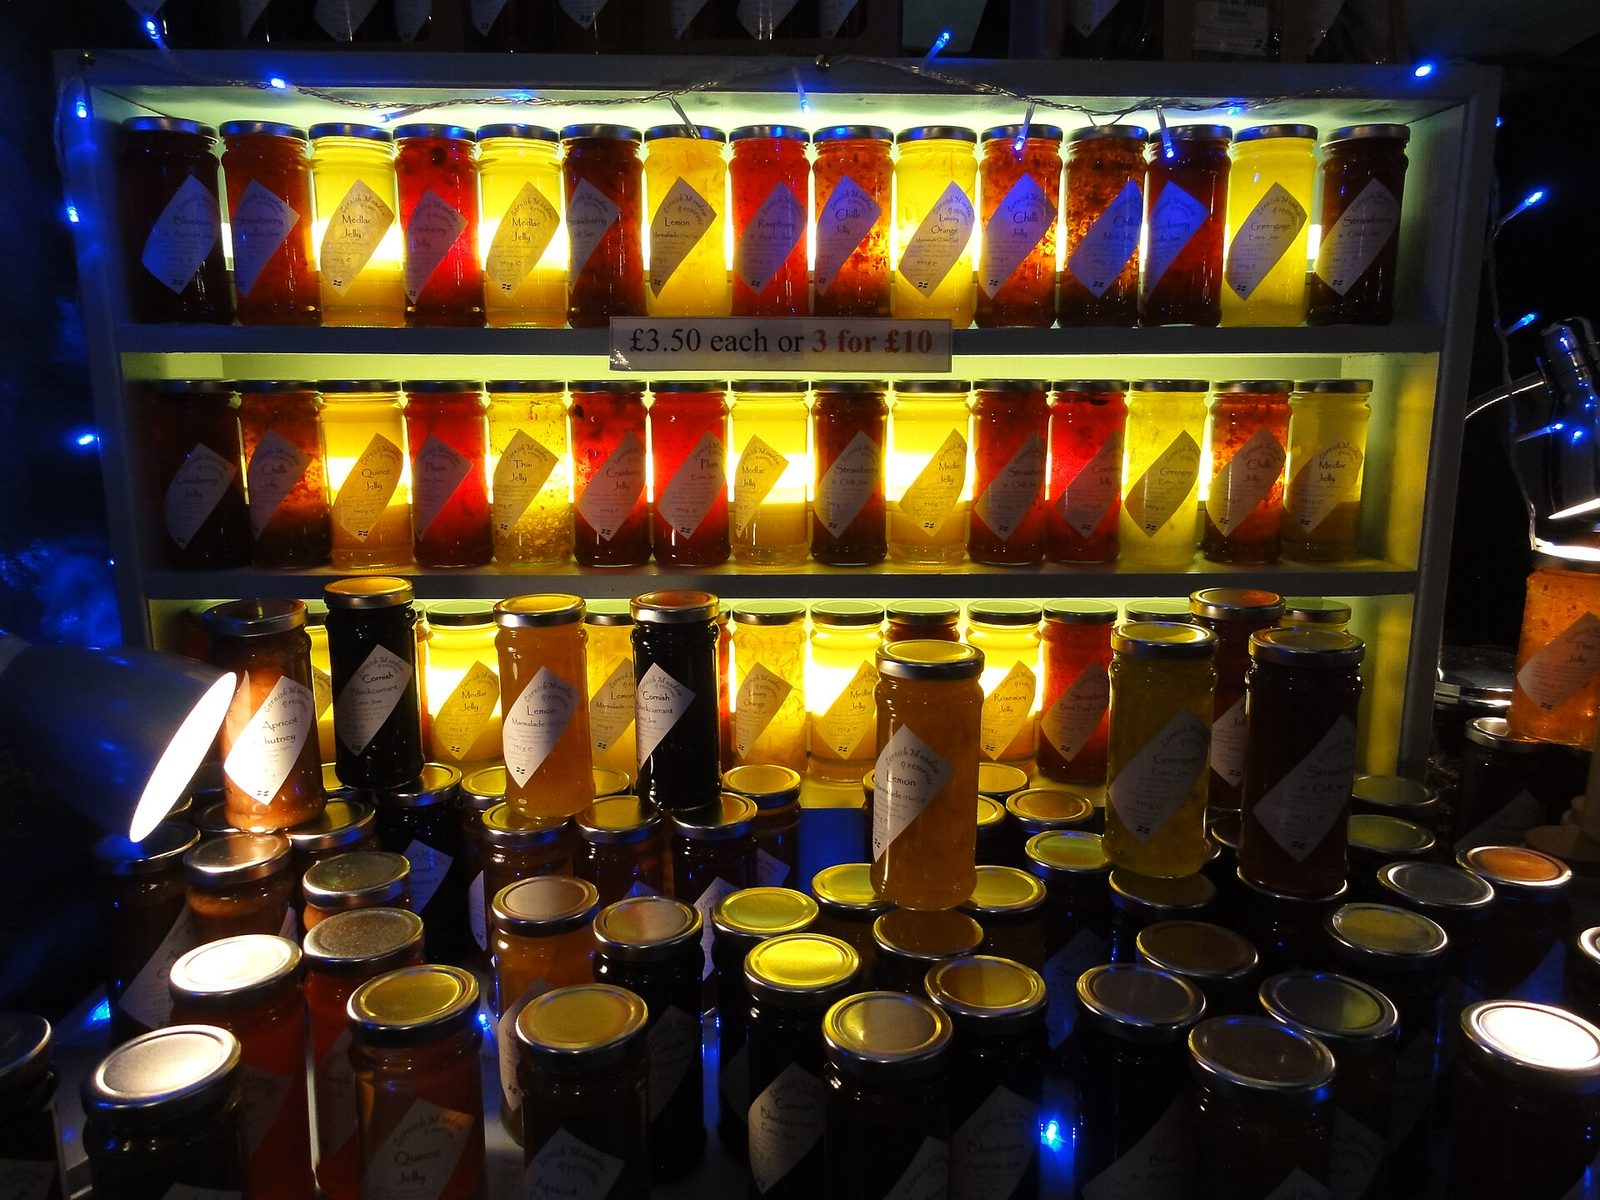
Few experiments in psychology have had a better afterlife than one involving jam. For two decades it has turned up in business books, talks and strategy decks, usually squeezed into a single line: give people 24 options and they buy less than when you give them 6.
That line is roughly true of one table, in one shop, on two Saturdays. What happened when other researchers tried it again is the better story, with a more useful lesson for anyone who chooses between options for a living.
A tasting table in Menlo Park
The study was run by Sheena Iyengar of Columbia University and Mark Lepper of Stanford, and published in 2000 in the Journal of Personality and Social Psychology. The setting was Draeger's, an upscale grocery store in Menlo Park, California, picked for its enormous range. The paper says it stocked roughly 250 kinds of mustard, 75 olive oils and over 300 varieties of jam.
On two consecutive Saturdays, two research assistants dressed as store staff set up a tasting booth for one brand of exotic jam. Every hour the table switched between two displays: 24 flavours or 6. Familiar flavours such as strawberry and raspberry had been taken out, so nobody could simply reach for an old favourite.
The six were picked with a survey of 30 Stanford undergraduates: two of the best-sounding flavours (kiwi and peach), two middling ones (black cherry and three-fruits marmalade) and two of the least appealing (lemon curd and red currant).
Anyone who stopped got a coupon for $1 off a jar, valid for a week. To use it, they had to walk to the jam shelf, where the full range sat, and pay at the till. A code on each coupon, disguised as a scan number, recorded which display the shopper had seen.
The big display pulled people in. Of the 242 shoppers who passed the 24-jam table, 145 (60%) stopped. Of the 260 who passed the six-jam table, 104 (40%) stopped.
Then came the purchases. Of the 104 who stopped at the small table, 31 bought a jar, which the paper rounds to "nearly 30%". Of the 145 who stopped at the big table, 4 did: 3%.
- Stopped at the 24-jam table60%
- Stopped at the 6-jam table40%
- Bought, after stopping at 24 jams3%
- Bought, after stopping at 6 jams30%
Source: Iyengar and Lepper (2000), Study 1. The paper reports nearly 30% (31 of 104) and 3% (4 of 145).
The authors backed it with two more studies. Students offered 6 essay topics for extra credit were more likely to hand one in than students offered 30 (74% against 60%), and people choosing from 6 chocolates rather than 30 were more likely to take chocolates over cash as payment (48% against 12%).
The detail that usually goes missing
The popular version says 30% of shoppers bought when offered six jams and 3% when offered 24. Those percentages are of the people who stopped at the table, not of everyone who walked past. Counting passers-by, 31 of 260 bought after seeing six jams and 4 of 242 after seeing 24.
Notice, too, how few purchases carry the whole result: 35 jars. The gap was large, but a finding built on 35 sales needs repeating before anyone builds a strategy on it.
Iyengar and Lepper were candid about the weak spots. Shoppers chose whether to approach the table, so the 24-jam display may have drawn curious browsers while the six-jam display drew people who were serious about buying jam. That is one reason they ran the follow-up studies, where people could not pick their own condition.
What happened when people tried again
Benjamin Scheibehenne tried. For his doctorate at Humboldt University in Berlin, he copied the design as closely as he could in an upscale Berlin grocery store known for its range. Two consecutive Saturdays, a table at the entrance, 24 exotic flavours of one brand or a set of 6, swapped every hour, and a discount coupon valid for a week.
He counted 504 customers at the table, about twice the original's 249. People at the big display tasted slightly more jam (1.6 flavours on average against 1.4). But the share who redeemed their coupon barely moved: 32% after seeing 24 jams and 33% after seeing 6.
- Menlo Park (2000), 6 jams30%
- Menlo Park (2000), 24 jams3%
- Berlin (2008), 6 jams33%
- Berlin (2008), 24 jams32%
Share of people who stopped at the table. Sources: Iyengar and Lepper (2000), Study 1; Scheibehenne (2008).
He worked out that his study had a better than 99.5% chance of detecting an effect as large as the original, had there been one. He also noted a difference in the set-up. His jars stood in an orderly row. According to Iyengar, he wrote, the original jars had been displayed "in a rather disordered and messy way".
One failed repeat could be bad luck. So in 2010 Scheibehenne, Rainer Greifeneder and Peter Todd gathered every choice overload experiment they could find, published or not: 50 experiments, 63 conditions, 5,036 people. Their verdict, in the Journal of Consumer Research, was an average effect of "virtually zero". On their scale the original jam study scored 0.77. The average across everything was 0.02.
The studies varied a lot, and a few patterns showed through. Journal articles were more likely than unpublished work to report overload, and more recent studies were less likely to find it. People with expertise or clear prior preferences did better with more options, not worse. And the authors found no set of conditions that reliably produced the effect.
When a long list does hurt
That could have been the end. In 2015 Alexander Chernev, Ulf Böckenholt and Joseph Goodman published a second meta-analysis, in the Journal of Consumer Psychology, covering 99 observations from 53 published studies and 7,202 people. Their headline differed. Once you account for the conditions people are choosing under, they found, the size of the range does have a significant effect.
Part of the gap between the two reviews is data, since the 2015 team used only peer-reviewed papers. Part is the statistical model. The two teams still read the evidence differently, and I don't think a blog post should pretend otherwise.
What makes the 2015 paper useful is its list of conditions. It names four that make overload more likely:
- The options are hard to compare. No option clearly beats the rest, or each is good in a different way.
- The task is hard. Time is short, the choice must be justified to someone else, or each option has many attributes to weigh.
- People don't know what they want. They lack expertise in the category or a clear picture of the ideal option.
- The goal is to get it over with, so people want to spend as little effort on the choice as they can.
Read the jam study against that list and it makes sense: exotic flavours nobody had tried, chosen in seconds in a busy shop by people with no strong preference. My reading of the research is that the number of options was never the whole problem. The trouble is how hard they are to compare.
Choosing a supplier
Businesses stand at the 24-jam table all the time. Picking a supplier ticks most of the 2015 list. The options differ on things that don't line up: one is cheaper, another has better references, a third can start sooner. The choice has to be defended to a finance team or a board. And the buyer may be buying in this category for the first time.
The research doesn't say "always cut the list". It says make the options comparable. Decide the three or four things that matter before looking at anyone. Score every option on the same terms. Then cut. A shortlist of four, each with one line on why it is there, is easier to decide from and easier to defend than a spreadsheet of twenty.
The expertise finding cuts the other way. If you already know exactly what you need, a long list does little harm. The trouble starts when you don't.
Choosing which accounts to chase
Sales teams have their own jam table: the account list. It is often an export of hundreds of companies that all fit the ideal client profile, sorted by name or revenue. Each is plausible, and nothing on the page says why one deserves a call this week rather than next quarter.
That is the 2015 list again. Nothing dominates, time is short, nobody knows which account is ready, and the rep needs meetings this month. The research predicts what happens next: the decision gets put off, and people fall back on the names they already know.
I would rather hand a team ten accounts, each with a reason to call now, than four hundred without one. A new leader, a fresh funding round, a move into a new market, a contract coming up for renewal. The reason does two jobs. It makes the accounts comparable, and it tells the person making the call what to open with.
Where Yarlis fits
This is the idea behind our Precision Market Mapping co-worker. It ranks the accounts worth winning and gives the why-now for each, so the team works from a list short enough to compare, and every name on it comes with a reason.
Sources
- Iyengar, S. S., and Lepper, M. R. (2000). When choice is demotivating: Can one desire too much of a good thing? Journal of Personality and Social Psychology, 79(6), 995-1006. The original jam, essay and chocolate studies.
- Scheibehenne, B. (2008). The Effect of Having Too Much Choice. Doctoral dissertation, Humboldt University of Berlin. Includes the Berlin replication of the jam study with 504 customers.
- Scheibehenne, B., Greifeneder, R., and Todd, P. M. (2010). Can there ever be too many options? A meta-analytic review of choice overload. Journal of Consumer Research, 37(3), 409-425. The first meta-analysis: 50 experiments, 5,036 people, mean effect near zero.
- Chernev, A., Böckenholt, U., and Goodman, J. (2015). Choice overload: A conceptual review and meta-analysis. Journal of Consumer Psychology, 25(2), 333-358. The second meta-analysis and the four conditions that make overload more likely.
Is your team working from a list it can't compare? Seven questions, two minutes.
Keep reading

Familiar and fast: what research says about how clients choose
A 1968 experiment, a test of 2,241 firms and two buyer surveys suggest clients pick the firm they know, then reward the one that answers first.
How clients choose, 7 min read
What happened when real workers were given generative AI
Two field studies of AI at work: who gained, who barely moved, and the task where it made smart consultants worse.
AI at work, 7 min read